Angola
 Argentina
 Bangladesh
 Bolivia
 Colombia
 Costa Rica
 Dominican Republic
 DRC
DRC
 Ecuador
 El Salvador
 Ethiopia
 France
 GCC
GCC
 Great Britain
 Guatemala
 Guinea
 Guyana
 Haiti
Haiti
 Honduras
 Italy
Italy
 Kenya
Kenya
 Madagascar
 Mexico
 Myanmar
 Nepal
Nepal
 Nicaragua
 Nigeria
 Panama
 Peru
Peru
 Philippines
 South Africa
 Spain
Spain
 Sri Lanka
 Tanzania
 Trinidad
 Turkey
 Uganda
 Zambia
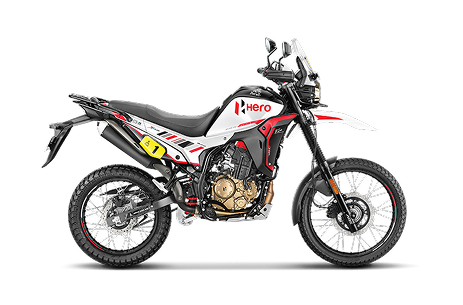
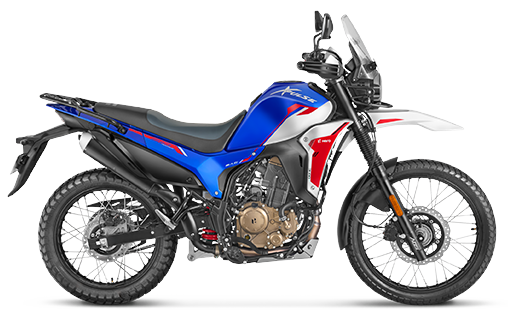
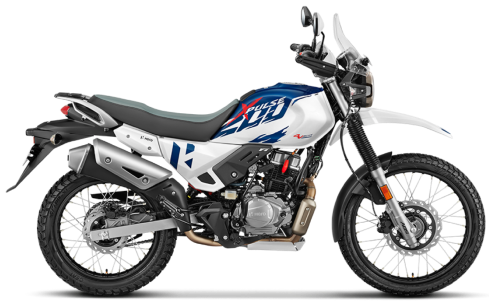
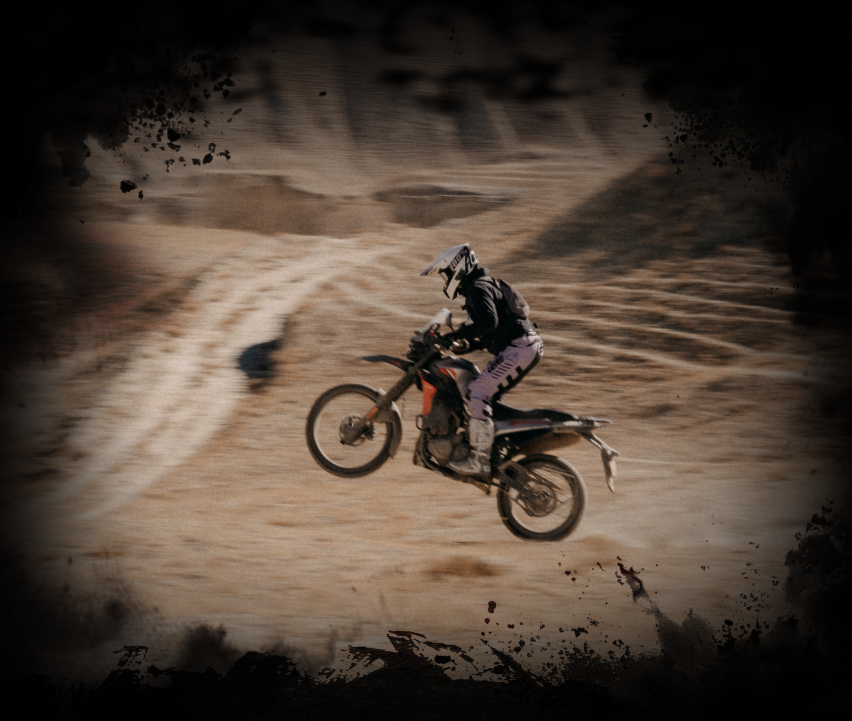
XPULSE 210 DAKAR EDITION
210 cc engine
210 cc engine
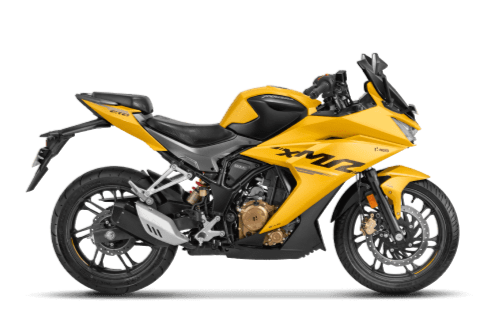
250 cc engine
210 cc engine
97.2 cc engine
97.2 cc engine
97.2 cc engine
97.2 cc engine
97.2 cc engine
97.2 cc engine
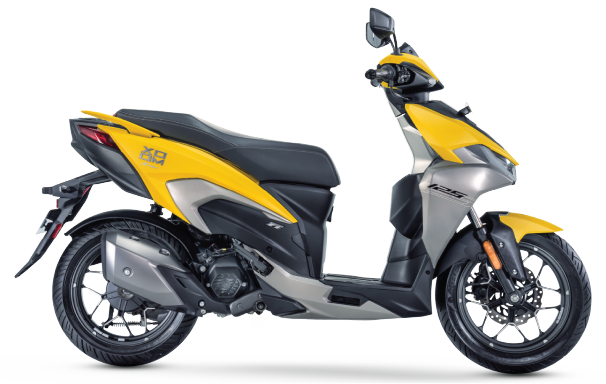
125 cc engine
125 cc engine
125 cc engine
124.7 cc engine
163.2 cc engine
163.2 cc engine
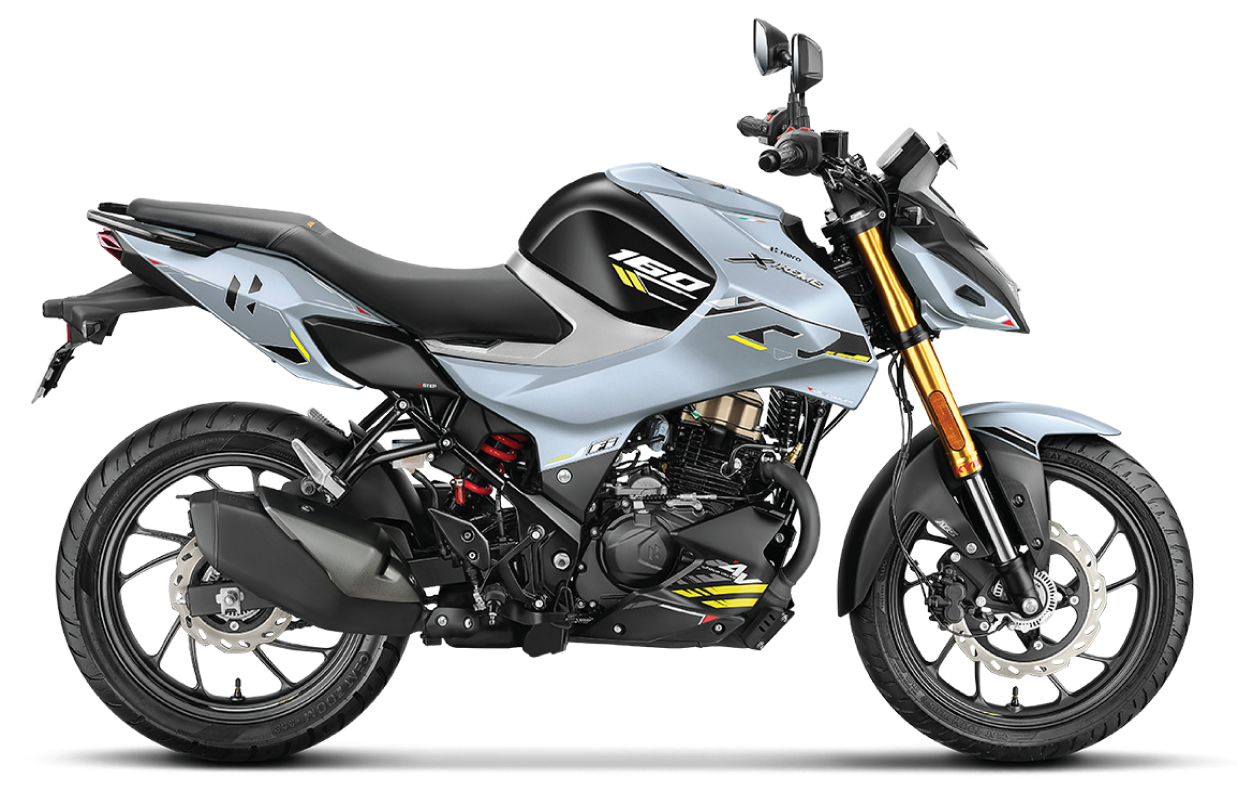
199.6 cc engine
210 cc engine
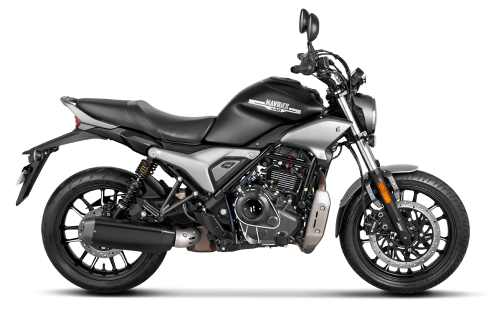
440 cc engine
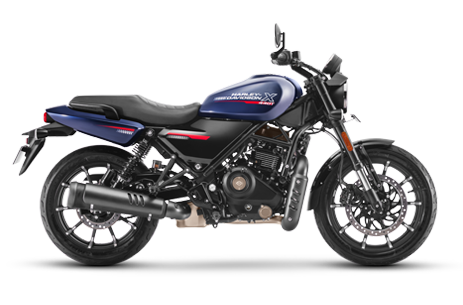
440 cc engine
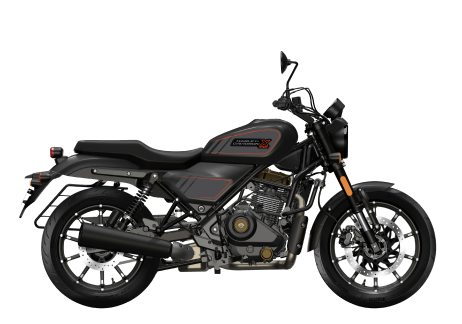
440 cc engine
210 cc
4 Stroke 4 Valve Single Cylinder Liquid Cooled DOHC
280mm | 270mm
Rear and Front suspension travel
250 cc
4 Stroke, 4 Valve, Single Cylinder Liquid Cooled, DOHC
25 nm
@7250 RPM
210 cc
4 Stroke 4 Valve Single Cylinder Liquid Cooled DOHC
20.7 nm
@7250 RPM
97.2 cc
Air cooled, 4 stroke
8.05 nm
@6000 RPM
97.2 cc
Air cooled, 4-stroke, Single cylinder, OHC
8.05 nm
@6000 RPM
97.2 cc
Air cooled, 4-stroke, Single cylinder, OHC
8.05 nm
@6000 RPM
97.2 cc
Air cooled, 4-stroke, Single cylinder, OHC
8.05 nm
@6000 RPM
97.2 cc
Air cooled, 4-stroke, Single cylinder, OHC
8.05 nm
@6000 RPM
97.2 cc
Air cooled, 4-stroke, Single cylinder, OHC
8.05 nm
@6000 RPM
125 cc
Air cooled, 4-Stroke
10.5 nm
@6500 RPM
125 cc
5.7 sec, Acceleartion 0-60kmph
10.5 nm
@6500 RPM
125 cc
Air cooled, 4-stroke, Single cylinder, OHC
10.6 nm
@6000 RPM
124.7 cc
Air Cooled, 4-Stroke, OHC, Single Cylinder
10.6 nm
@6000 RPM
163.2 cc
Air oil cooled, 4-stroke, Single cylinder, OHC
14.6 nm
@6500 RPM
163.2 cc
Air Cooled 4 stroke
14 nm
@6500 RPM
199.6 cc
Oil Cooled, 4 stroke 4 Valve single cylinder OHC
17.35 nm
@6500 RPM
210 cc
Liquid cooled, 4-stroke, Single cylinder, OHC
20.4 nm
@4000 RPM
440 cc
Oil cooled, 4-stroke, Single cylinder, OHC
36 nm
@4000 RPM
440 cc
Air cooled, 4-stroke, Single cylinder, OHC
38 nm
@4000 RPM
440 cc
Air cooled, 4-stroke, Single cylinder, OHC
38 nm
@4000 RPM
210 cc engine
250 cc engine
210 cc engine
97.2 cc engine
97.2 cc engine
97.2 cc engine
97.2 cc engine
97.2 cc engine
97.2 cc engine
125 cc engine
125 cc engine
125 cc engine
124.7 cc engine
163.2 cc engine
163.2 cc engine
199.6 cc engine
210 cc engine
440 cc engine
440 cc engine
440 cc engine
210 cc
4 Stroke 4 Valve Single Cylinder Liquid Cooled DOHC
280mm | 270mm
Rear and Front suspension travel
250 cc
4 Stroke, 4 Valve, Single Cylinder Liquid Cooled, DOHC
25 nm
@7250 RPM
210 cc
4 Stroke 4 Valve Single Cylinder Liquid Cooled DOHC
20.7 nm
@7250 RPM
97.2 cc
Air cooled, 4 stroke
8.05 nm
@6000 RPM
97.2 cc
Air cooled, 4-stroke, Single cylinder, OHC
8.05 nm
@6000 RPM
97.2 cc
Air cooled, 4-stroke, Single cylinder, OHC
8.05 nm
@6000 RPM
97.2 cc
Air cooled, 4-stroke, Single cylinder, OHC
8.05 nm
@6000 RPM
97.2 cc
Air cooled, 4-stroke, Single cylinder, OHC
8.05 nm
@6000 RPM
97.2 cc
Air cooled, 4-stroke, Single cylinder, OHC
8.05 nm
@6000 RPM
125 cc
Air cooled, 4-Stroke
10.5 nm
@6500 RPM
125 cc
5.7 sec, Acceleartion 0-60kmph
10.5 nm
@6500 RPM
125 cc
Air cooled, 4-stroke, Single cylinder, OHC
10.6 nm
@6000 RPM
124.7 cc
Air Cooled, 4-Stroke, OHC, Single Cylinder
10.6 nm
@6000 RPM
163.2 cc
Air oil cooled, 4-stroke, Single cylinder, OHC
14.6 nm
@6500 RPM
163.2 cc
Air Cooled 4 stroke
14 nm
@6500 RPM
199.6 cc
Oil Cooled, 4 stroke 4 Valve single cylinder OHC
17.35 nm
@6500 RPM
210 cc
Liquid cooled, 4-stroke, Single cylinder, OHC
20.4 nm
@4000 RPM
440 cc
Oil cooled, 4-stroke, Single cylinder, OHC
36 nm
@4000 RPM
440 cc
Air cooled, 4-stroke, Single cylinder, OHC
38 nm
@4000 RPM
440 cc
Air cooled, 4-stroke, Single cylinder, OHC
38 nm
@4000 RPM
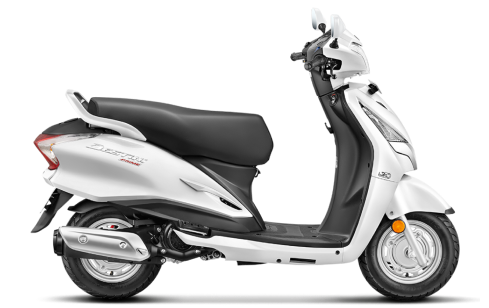
110 cc engine

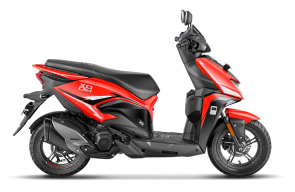
125 cc engine
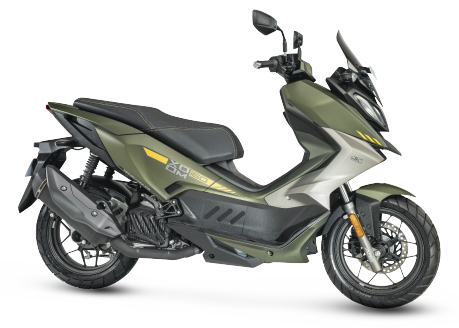
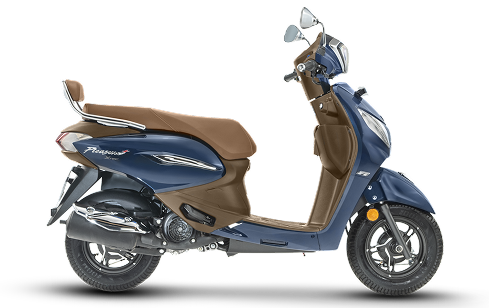
156 cc engine
124.6 cc engine
124.6 cc engine
110.9 cc engine
110.9 cc engine
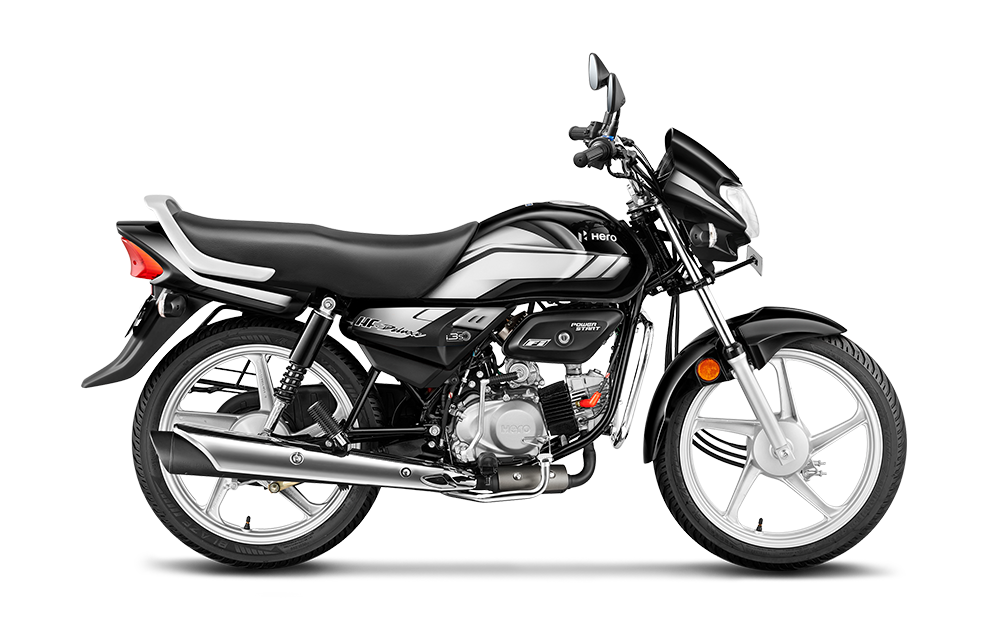
110 cc
Air Cooled, 4 stroke engine
8.7 nm
@5750 RPM
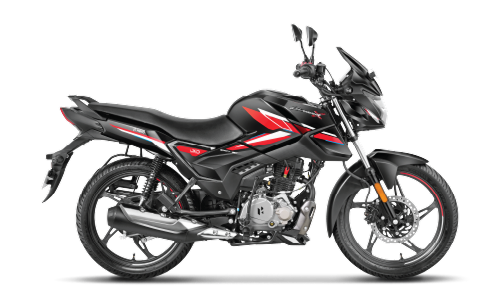
125 cc
Air cooled, 4 stroke, SI engine
10.4 nm
@5500 RPM
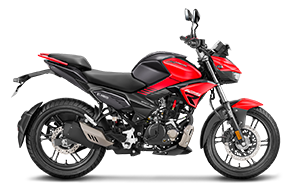
156 cc
Liquid cooled, 4 Valve single cylinder SOHC
14 nm
@6250 RPM
124.6 cc
Air Cooled, 4 stroke, SI
10.4 nm
@6000 RPM
124.6 cc
Air Cooled, 4-Stroke, SI Engine
10.36 nm
@5500 RPM
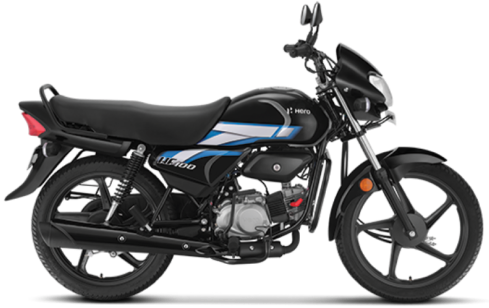
110.9 cc
Air cooled, 4-stroke, SI engine
8.70 nm
@5750 RPM
110.9 cc
Air cooled, 4-stroke Single Cylinder OHC
8.70 nm
@5500 RPM
110 cc engine
125 cc engine
156 cc engine
124.6 cc engine
124.6 cc engine
110.9 cc engine
110.9 cc engine
110 cc
Air Cooled, 4 stroke engine
8.7 nm
@5750 RPM
125 cc
Air cooled, 4 stroke, SI engine
10.4 nm
@5500 RPM
156 cc
Liquid cooled, 4 Valve single cylinder SOHC
14 nm
@6250 RPM
124.6 cc
Air Cooled, 4 stroke, SI
10.4 nm
@6000 RPM
124.6 cc
Air Cooled, 4-Stroke, SI Engine
10.36 nm
@5500 RPM
110.9 cc
Air cooled, 4-stroke, SI engine
8.70 nm
@5750 RPM
110.9 cc
Air cooled, 4-stroke Single Cylinder OHC
8.70 nm
@5500 RPM


How can we help you?
SPECIAL OFFERS

210 cc engine
250 cc engine
210 cc engine
97.2 cc engine
97.2 cc engine
97.2 cc engine
97.2 cc engine
97.2 cc engine
97.2 cc engine
125 cc engine
125 cc engine
125 cc engine
124.7 cc engine
163.2 cc engine
163.2 cc engine
199.6 cc engine
210 cc engine
440 cc engine
440 cc engine
440 cc engine
210 cc
4 Stroke 4 Valve Single Cylinder Liquid Cooled DOHC
280mm | 270mm
Rear and Front suspension travel
250 cc
4 Stroke, 4 Valve, Single Cylinder Liquid Cooled, DOHC
25 nm
@7250 RPM
210 cc
4 Stroke 4 Valve Single Cylinder Liquid Cooled DOHC
20.7 nm
@7250 RPM
97.2 cc
Air cooled, 4 stroke
8.05 nm
@6000 RPM
97.2 cc
Air cooled, 4-stroke, Single cylinder, OHC
8.05 nm
@6000 RPM
97.2 cc
Air cooled, 4-stroke, Single cylinder, OHC
8.05 nm
@6000 RPM
97.2 cc
Air cooled, 4-stroke, Single cylinder, OHC
8.05 nm
@6000 RPM
97.2 cc
Air cooled, 4-stroke, Single cylinder, OHC
8.05 nm
@6000 RPM
97.2 cc
Air cooled, 4-stroke, Single cylinder, OHC
8.05 nm
@6000 RPM
125 cc
Air cooled, 4-Stroke
10.5 nm
@6500 RPM
125 cc
5.7 sec, Acceleartion 0-60kmph
10.5 nm
@6500 RPM
125 cc
Air cooled, 4-stroke, Single cylinder, OHC
10.6 nm
@6000 RPM
124.7 cc
Air Cooled, 4-Stroke, OHC, Single Cylinder
10.6 nm
@6000 RPM
163.2 cc
Air oil cooled, 4-stroke, Single cylinder, OHC
14.6 nm
@6500 RPM
163.2 cc
Air Cooled 4 stroke
14 nm
@6500 RPM
199.6 cc
Oil Cooled, 4 stroke 4 Valve single cylinder OHC
17.35 nm
@6500 RPM
210 cc
Liquid cooled, 4-stroke, Single cylinder, OHC
20.4 nm
@4000 RPM
440 cc
Oil cooled, 4-stroke, Single cylinder, OHC
36 nm
@4000 RPM
440 cc
Air cooled, 4-stroke, Single cylinder, OHC
38 nm
@4000 RPM
440 cc
Air cooled, 4-stroke, Single cylinder, OHC
38 nm
@4000 RPM
210 cc engine
250 cc engine
210 cc engine
97.2 cc engine
97.2 cc engine
97.2 cc engine
97.2 cc engine
97.2 cc engine
97.2 cc engine
125 cc engine
125 cc engine
125 cc engine
124.7 cc engine
163.2 cc engine
163.2 cc engine
199.6 cc engine
210 cc engine
440 cc engine
440 cc engine
440 cc engine
210 cc
4 Stroke 4 Valve Single Cylinder Liquid Cooled DOHC
280mm | 270mm
Rear and Front suspension travel
250 cc
4 Stroke, 4 Valve, Single Cylinder Liquid Cooled, DOHC
25 nm
@7250 RPM
210 cc
4 Stroke 4 Valve Single Cylinder Liquid Cooled DOHC
20.7 nm
@7250 RPM
97.2 cc
Air cooled, 4 stroke
8.05 nm
@6000 RPM
97.2 cc
Air cooled, 4-stroke, Single cylinder, OHC
8.05 nm
@6000 RPM
97.2 cc
Air cooled, 4-stroke, Single cylinder, OHC
8.05 nm
@6000 RPM
97.2 cc
Air cooled, 4-stroke, Single cylinder, OHC
8.05 nm
@6000 RPM
97.2 cc
Air cooled, 4-stroke, Single cylinder, OHC
8.05 nm
@6000 RPM
97.2 cc
Air cooled, 4-stroke, Single cylinder, OHC
8.05 nm
@6000 RPM
125 cc
Air cooled, 4-Stroke
10.5 nm
@6500 RPM
125 cc
5.7 sec, Acceleartion 0-60kmph
10.5 nm
@6500 RPM
125 cc
Air cooled, 4-stroke, Single cylinder, OHC
10.6 nm
@6000 RPM
124.7 cc
Air Cooled, 4-Stroke, OHC, Single Cylinder
10.6 nm
@6000 RPM
163.2 cc
Air oil cooled, 4-stroke, Single cylinder, OHC
14.6 nm
@6500 RPM
163.2 cc
Air Cooled 4 stroke
14 nm
@6500 RPM
199.6 cc
Oil Cooled, 4 stroke 4 Valve single cylinder OHC
17.35 nm
@6500 RPM
210 cc
Liquid cooled, 4-stroke, Single cylinder, OHC
20.4 nm
@4000 RPM
440 cc
Oil cooled, 4-stroke, Single cylinder, OHC
36 nm
@4000 RPM
440 cc
Air cooled, 4-stroke, Single cylinder, OHC
38 nm
@4000 RPM
440 cc
Air cooled, 4-stroke, Single cylinder, OHC
38 nm
@4000 RPM

110 cc engine
125 cc engine
156 cc engine
124.6 cc engine
124.6 cc engine
110.9 cc engine
110.9 cc engine
110 cc
Air Cooled, 4 stroke engine
8.7 nm
@5750 RPM
125 cc
Air cooled, 4 stroke, SI engine
10.4 nm
@5500 RPM
156 cc
Liquid cooled, 4 Valve single cylinder SOHC
14 nm
@6250 RPM
124.6 cc
Air Cooled, 4 stroke, SI
10.4 nm
@6000 RPM
124.6 cc
Air Cooled, 4-Stroke, SI Engine
10.36 nm
@5500 RPM
110.9 cc
Air cooled, 4-stroke, SI engine
8.70 nm
@5750 RPM
110.9 cc
Air cooled, 4-stroke Single Cylinder OHC
8.70 nm
@5500 RPM

NO MOTORCYCLE FOUND
Please change your engine and price range
NO SCOOTERS FOUND
Please change your engine and price range
Rides & Community
Stay ahead of the curve with us!
Rides & Community
Stay ahead of the curve with us!

FINANCIAL REPORTS AND PRESENTATIONS
DOWNLOADCREATE. COLLABORATE. INSPIRE
EXPLORE CAREER OPTIONS

%201.png)